Automatic
Picks the 5–12 stages worth showing from arbitrary architectures and folds away activations, normalization and reshapes. Override any choice by name, type or regex.
pymodelvis · neural_flow for PyTorch
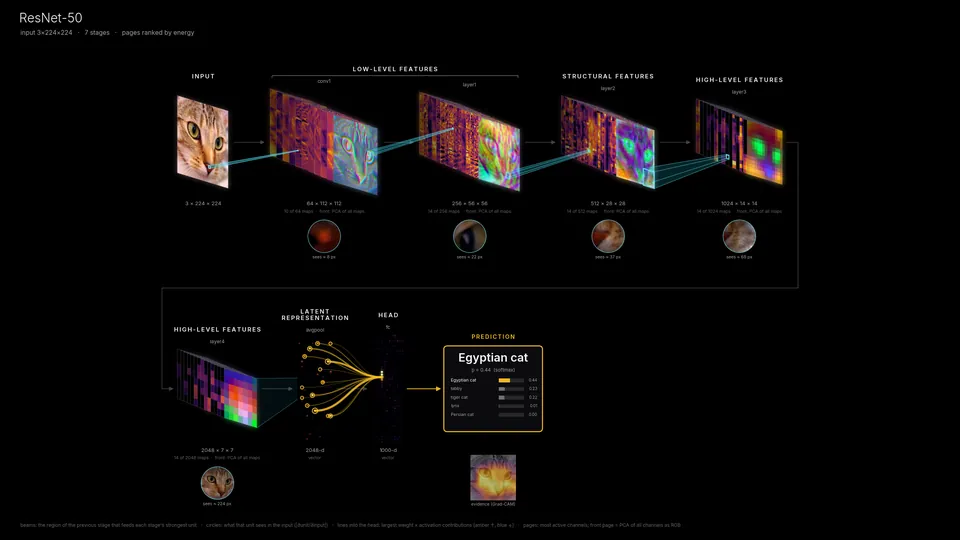
Graph viewers draw a model's operations. neural_flow draws what one specific input becomes inside it — stage by stage, from pixels or voxels to the prediction — with the evidence for each step. As figures for papers and talks, an interactive explorer, and movies over changing inputs.
pip install "pymodelvis[all] @ git+https://github.com/MASILab/pymodelvis"
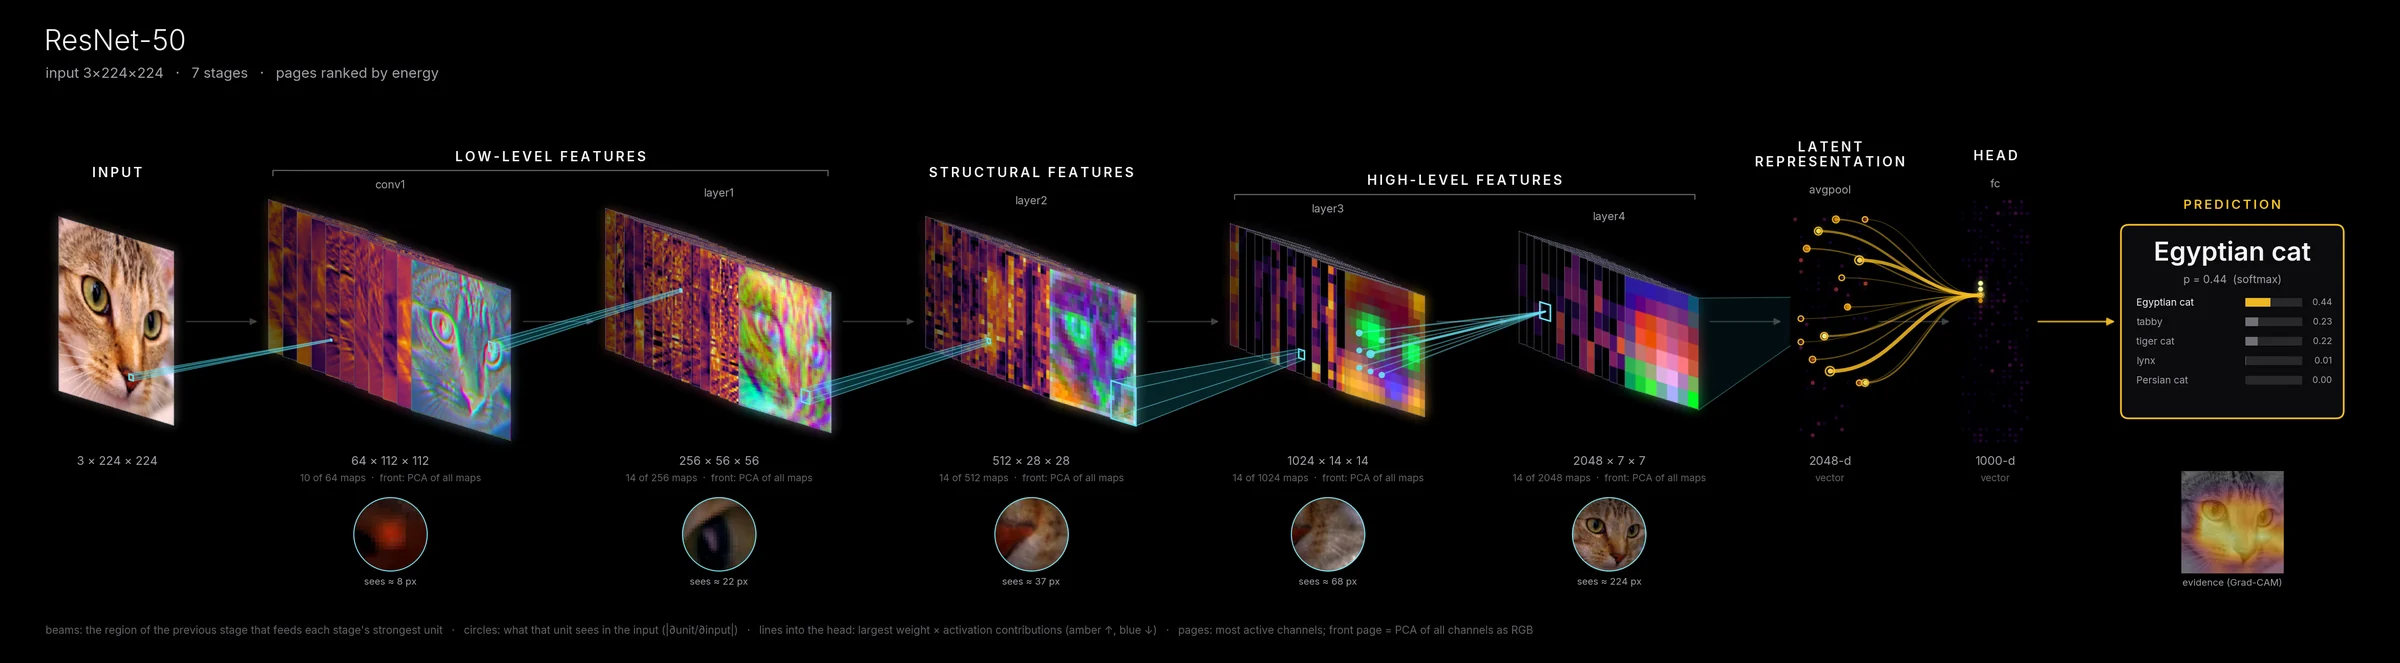
Installing adds a neural-flow command. Point it at a model and an input; it
picks the stages worth showing, runs the model once, and writes the figure.
Models can be built-in names, any torchvision or timm model, a MONAI bundle, a saved
model.pt, or your own my_net.py:Class with a checkpoint.
# the cat above
$ neural-flow demo cat

# your photo, a real model
$ neural-flow render resnet50 -i photo.jpg \
      --style cinematic -o flow.png

# your 3-D U-Net on a NIfTI volume
$ neural-flow render my_unet.py:UNet3D \
      --weights best.pt -i t1.nii.gz --crop 96

# a movie: which region matters?
$ neural-flow movie cxr --occlusion chest.png -o occ.mp4
visualize_model works with any nn.Module: CNNs, U-Nets, vision
transformers, 3-D medical networks, and models with several inputs or heads. Hooks are
always removed and the model is never modified.
from neural_flow import visualize_model, animate_inputs visualize_model(model, x, output="flow.png", style="cinematic") visualize_model(model, x, output="explore.html") # several inputs, several heads, 3-D volumes visualize_model(model, {"mri": vol,"clinical": v}) # a movie over a sequence of inputs animate_inputs(model, frames, output="pan.mp4")
Picks the 5–12 stages worth showing from arbitrary architectures and folds away activations, normalization and reshapes. Override any choice by name, type or regex.
Every pixel comes from the actual input. Outputs are shown as probabilities only when
they are probabilities, and summarized stages are marked ≈.
Receptive fields, stage-to-stage dependencies, weight × activation contributions and Grad-CAM, all computed from gradients for the input you give it.
[B, C, X, Y, Z] is a first-class object: anatomy becomes translucent voxel
blocks, with activation-driven orthogonal slices and 3-D segmentations.
Large activations are summarized on the model's own device within a memory budget. Visualization problems never break your forward pass.
Black cinematic, technical and teaching styles; PNG, SVG and PDF; an interactive HTML explorer; MP4 and GIF movies; a bundled typeface.
Real pretrained weights where they exist; demo models trained on synthetic data otherwise.
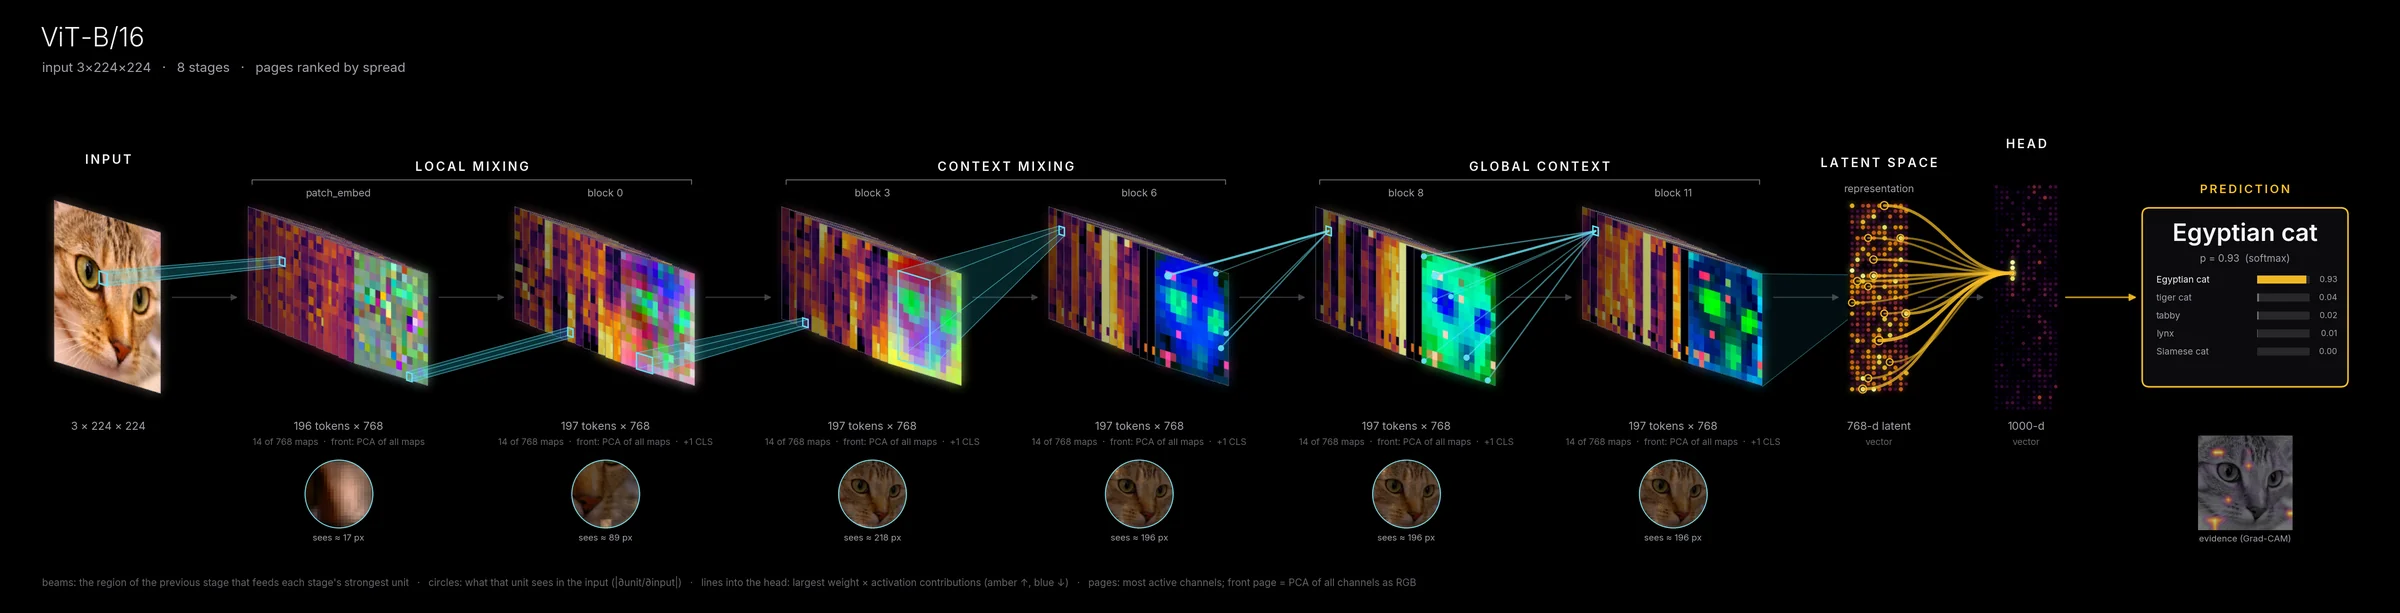
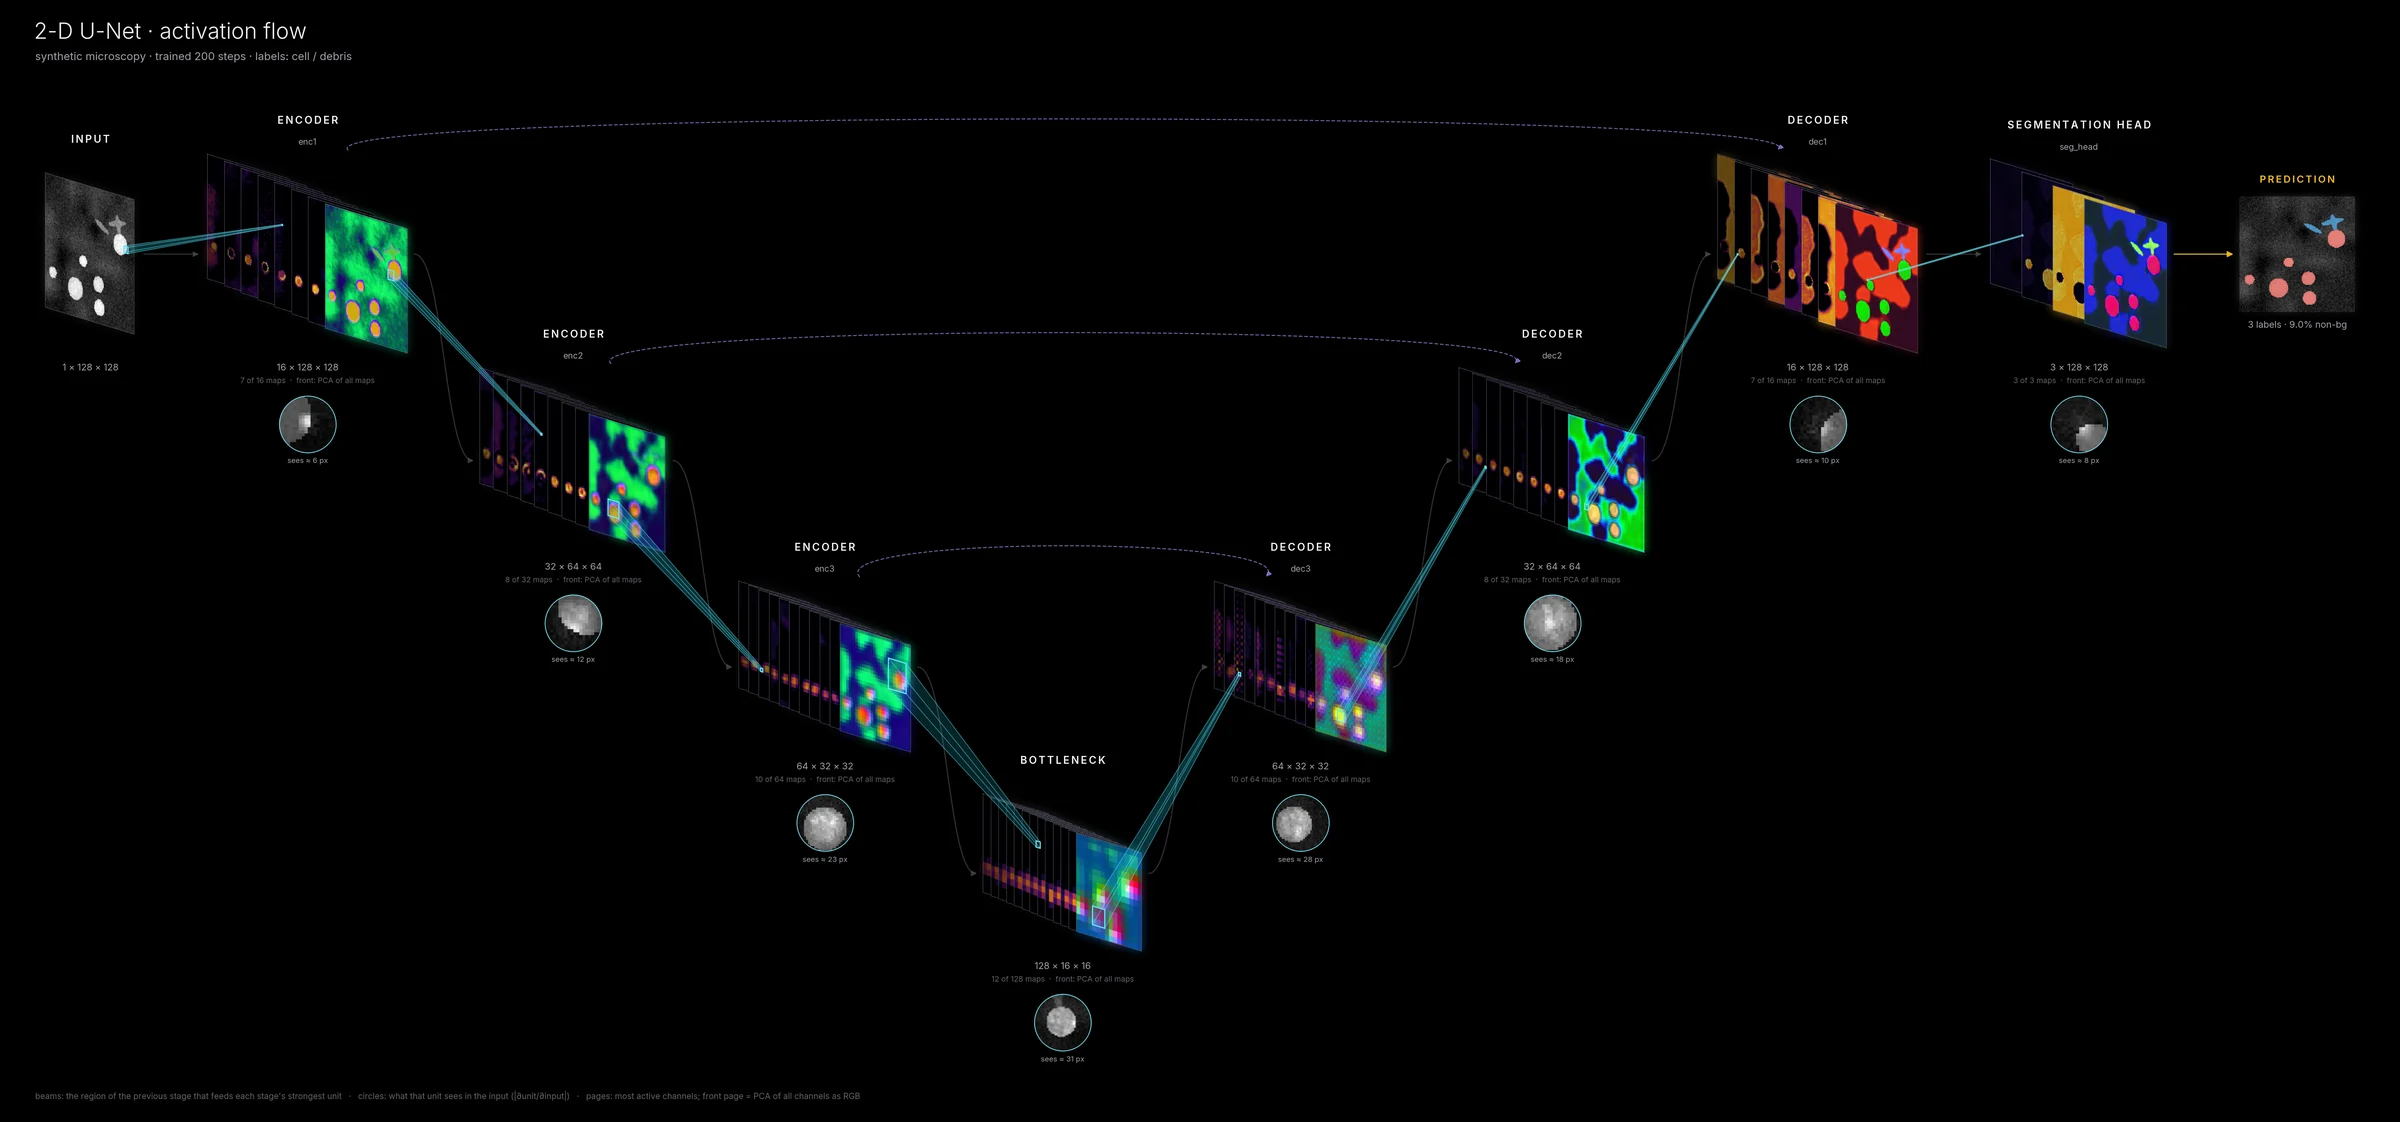
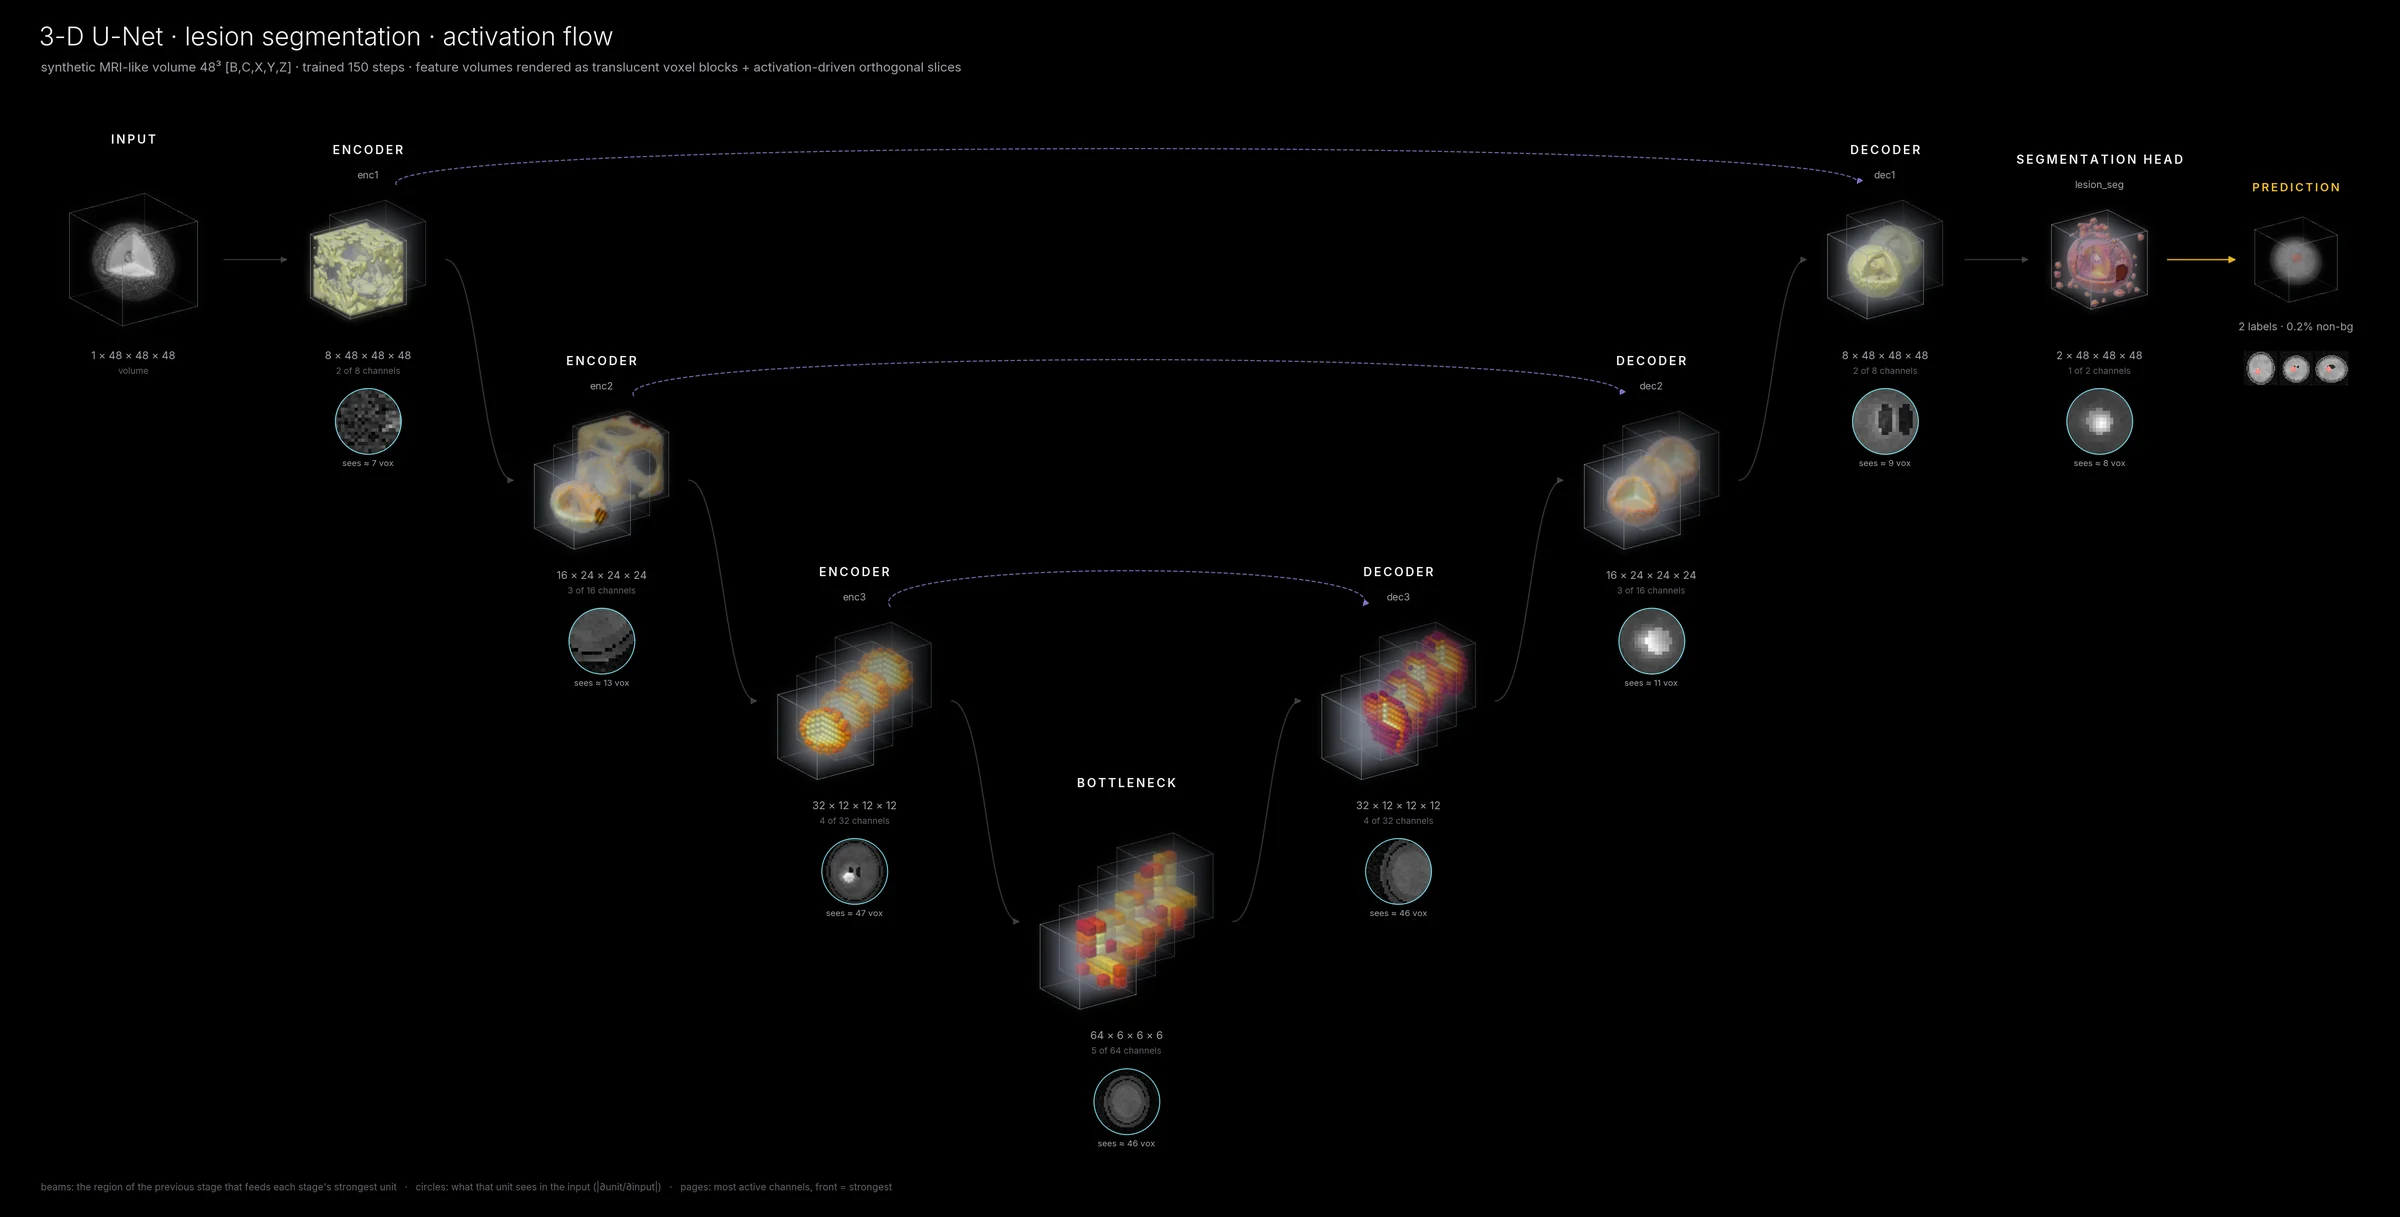
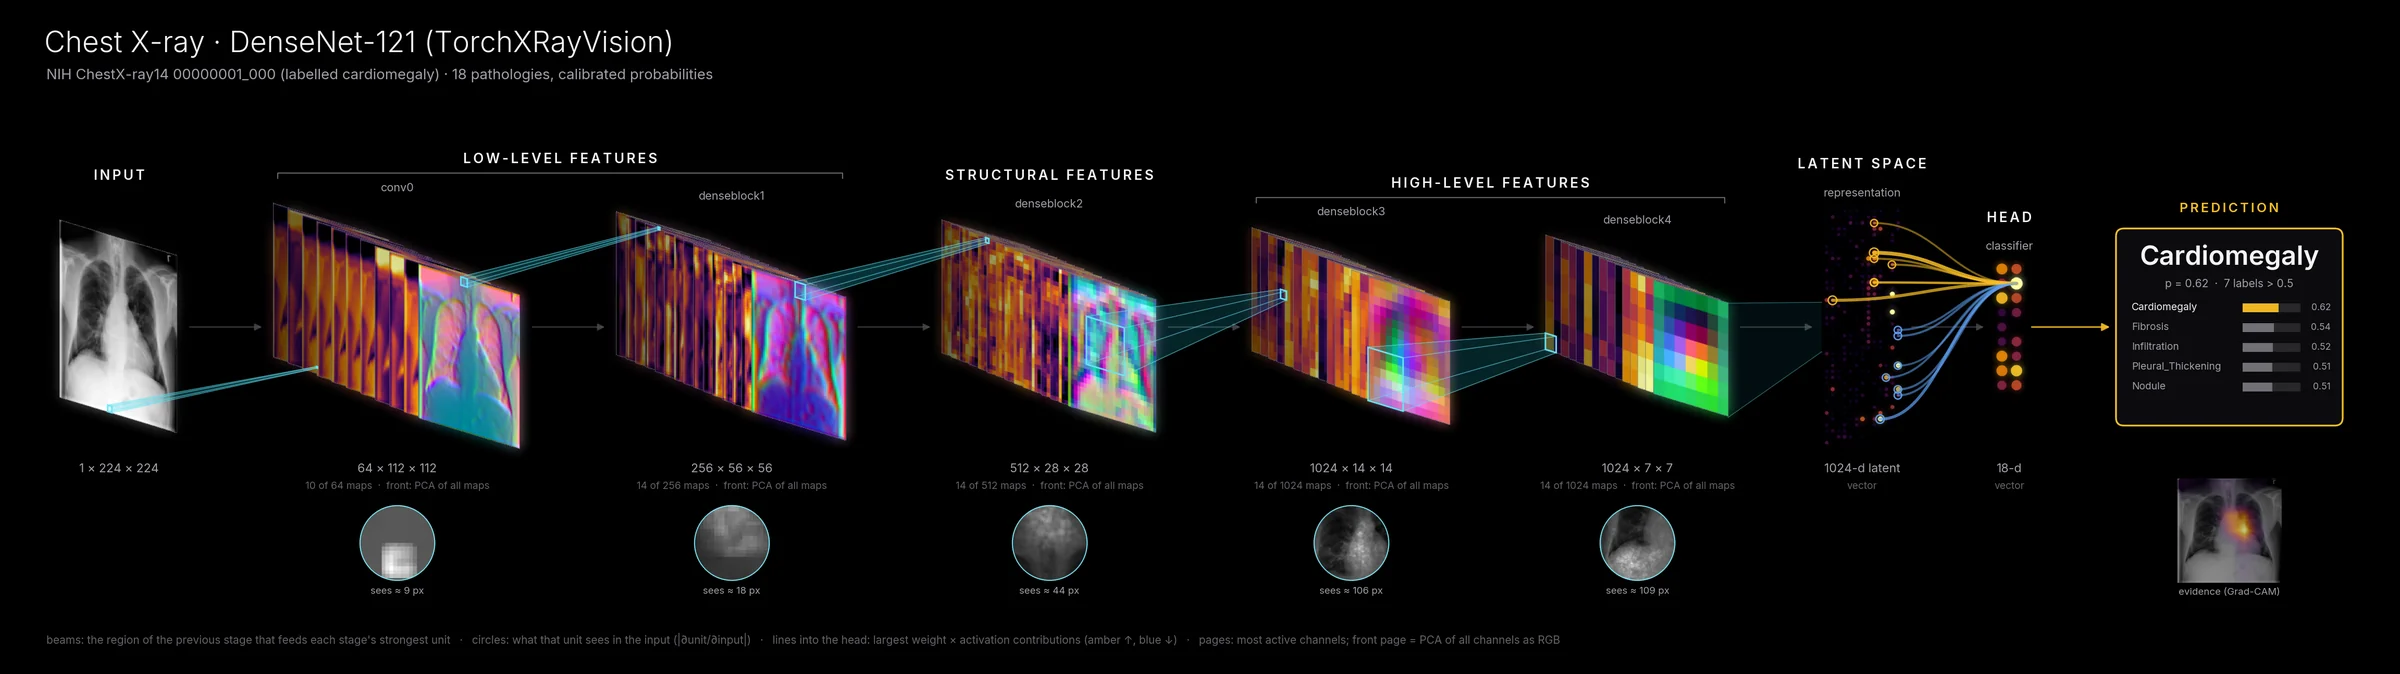
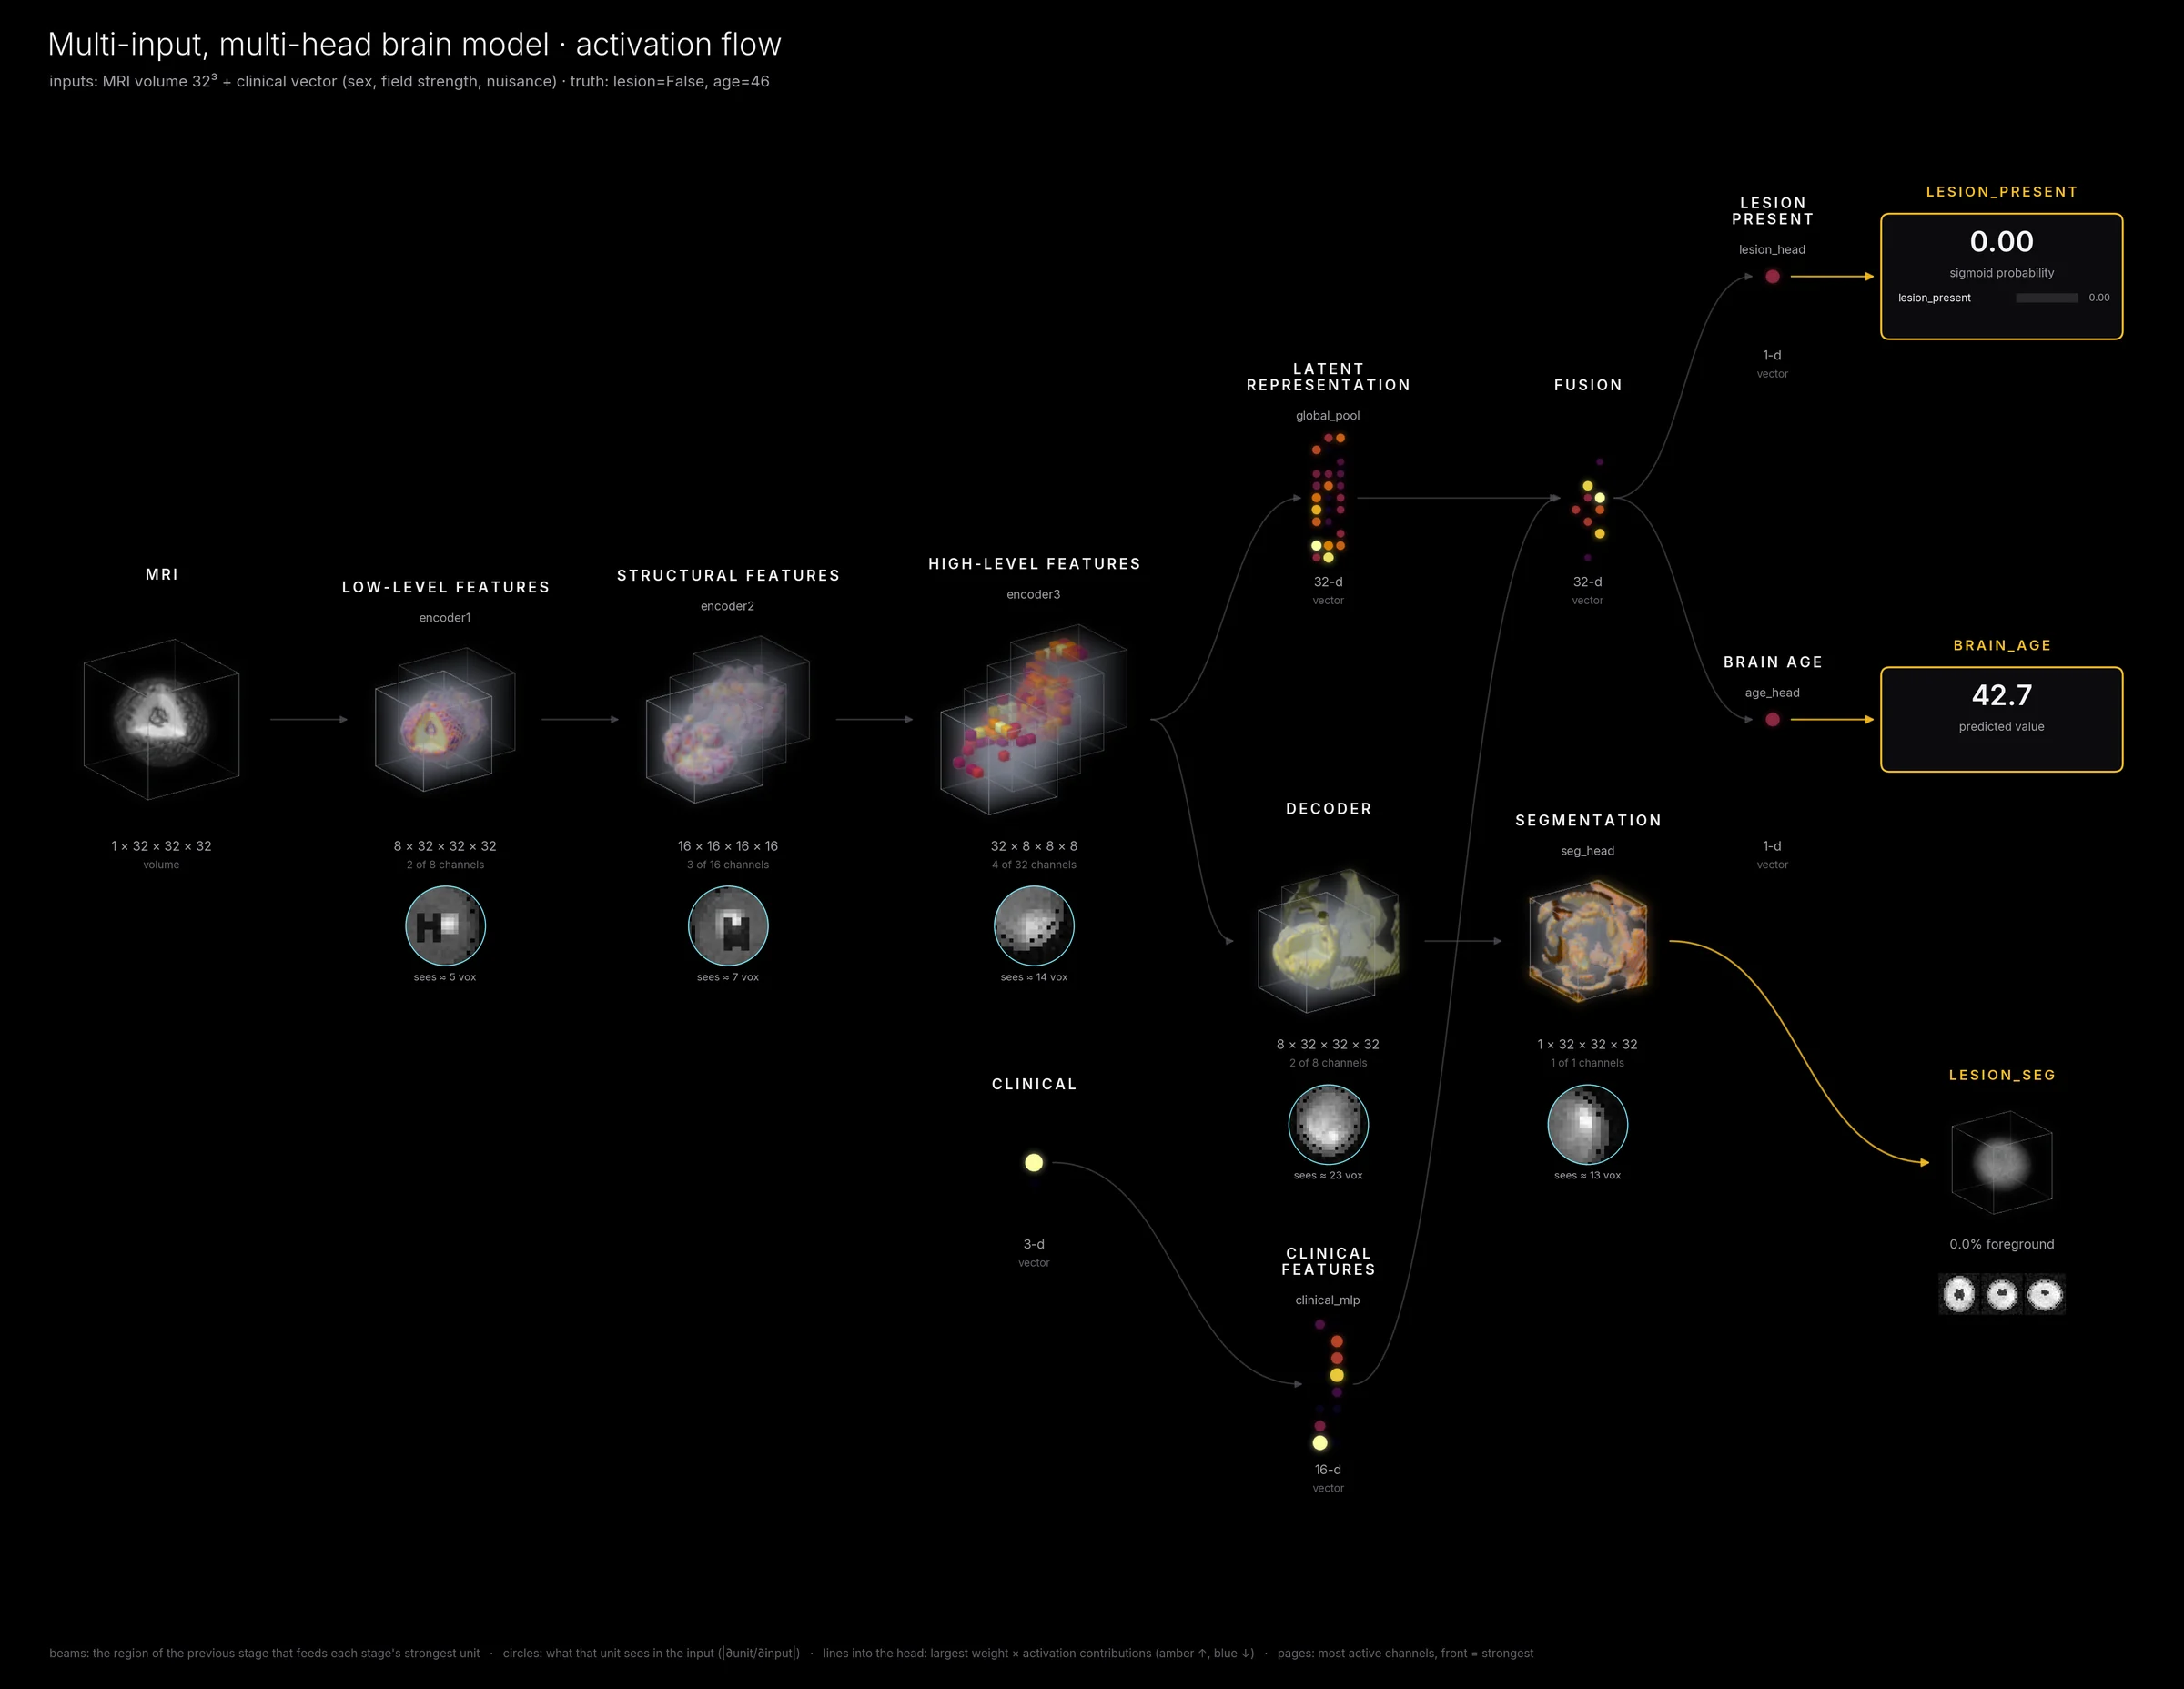
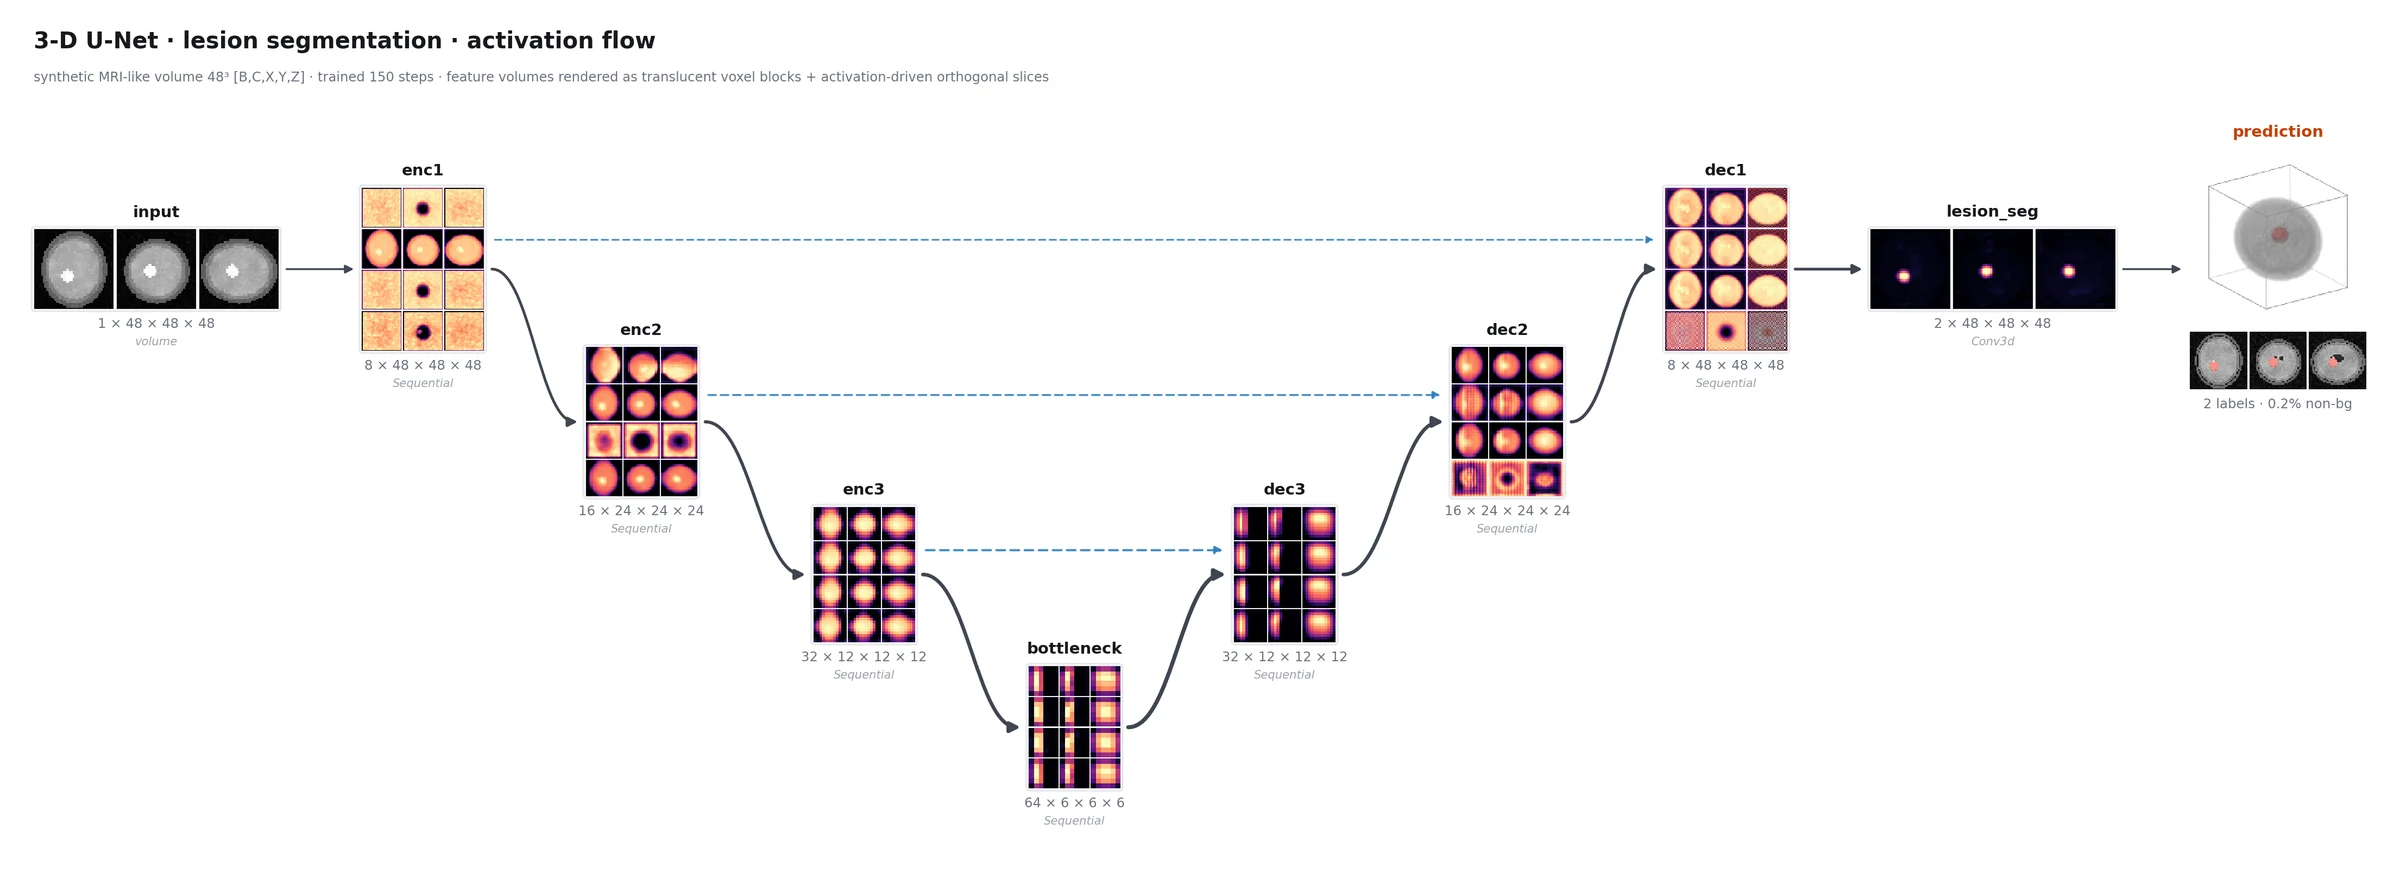
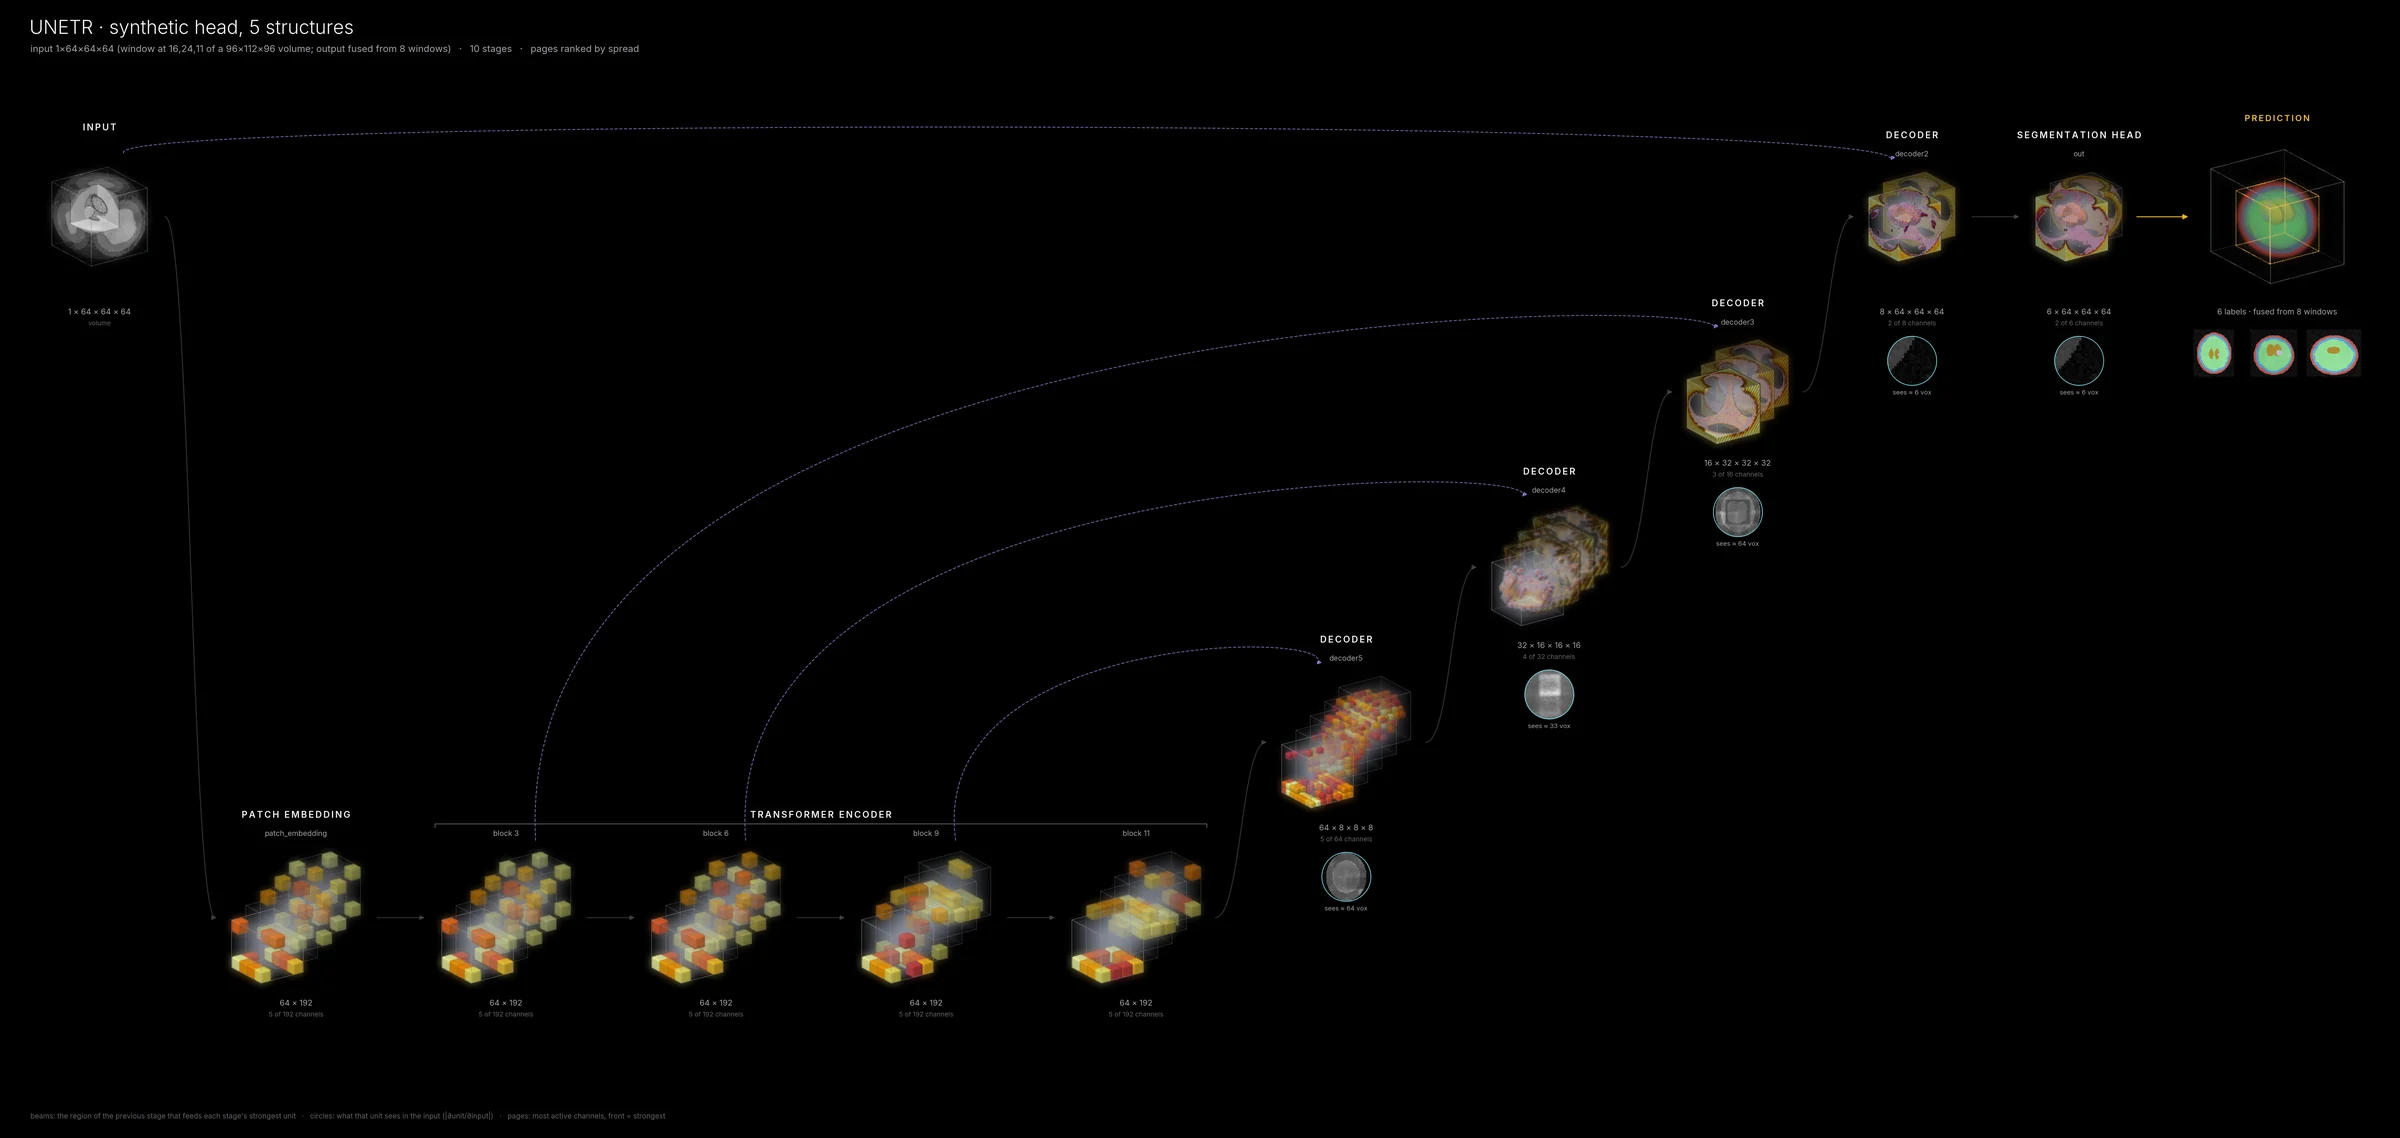
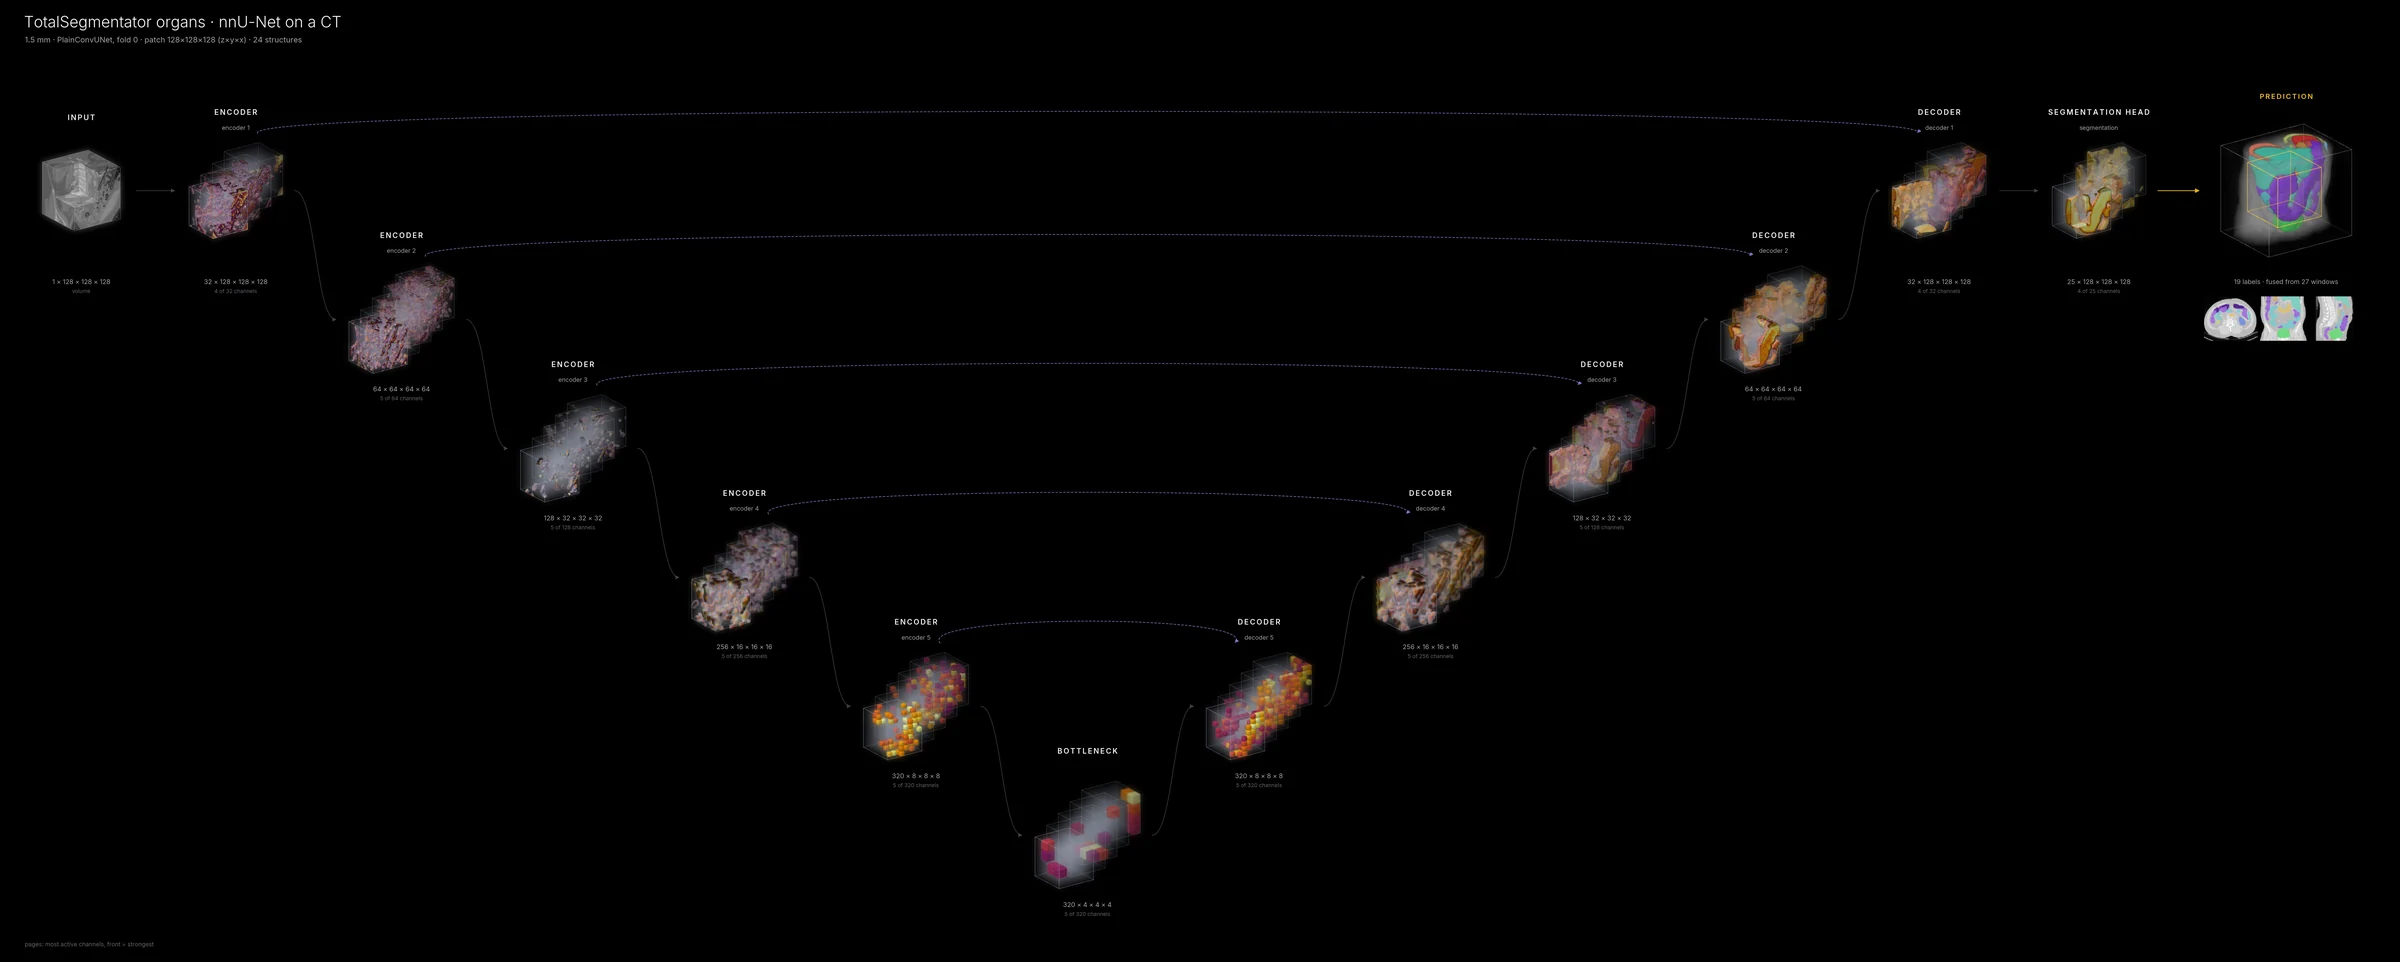
[B, C, X, Y, Z] volumes are first-class. Transformer U-Nets such as UNETR, Swin UNETR and
MASI's UNesT show their transformer levels as stages and their decoder as a U; the output card shows
the whole scan fused from sliding windows, with the traced window outlined; everything is
drawn to scale from the voxel spacing.
# MASI UNesT, 133 brain structures, whole brain from sliding windows
$ neural-flow fetch unest
$ neural-flow render unest -i T1_mni.nii.gz --sliding-window --style cinematic

# watch 3-D inference, window by window
$ neural-flow movie unest --inference T1_mni.nii.gz --max-windows 16

# any trained nnU-Net, or TotalSegmentator on its example CT
$ neural-flow render nnunet:$nnUNet_results/Dataset123_Liver -i case.nii.gz --sliding-window
$ neural-flow render totalseg -i sample:ct --sliding-window --style cinematic
Stages, channels, colours and scales are held fixed across frames, so everything that moves is the network responding.
The same captured activations, drawn for a talk, a paper, a classroom or a poster.
style="cinematic" — black, feature-map stacks, explanations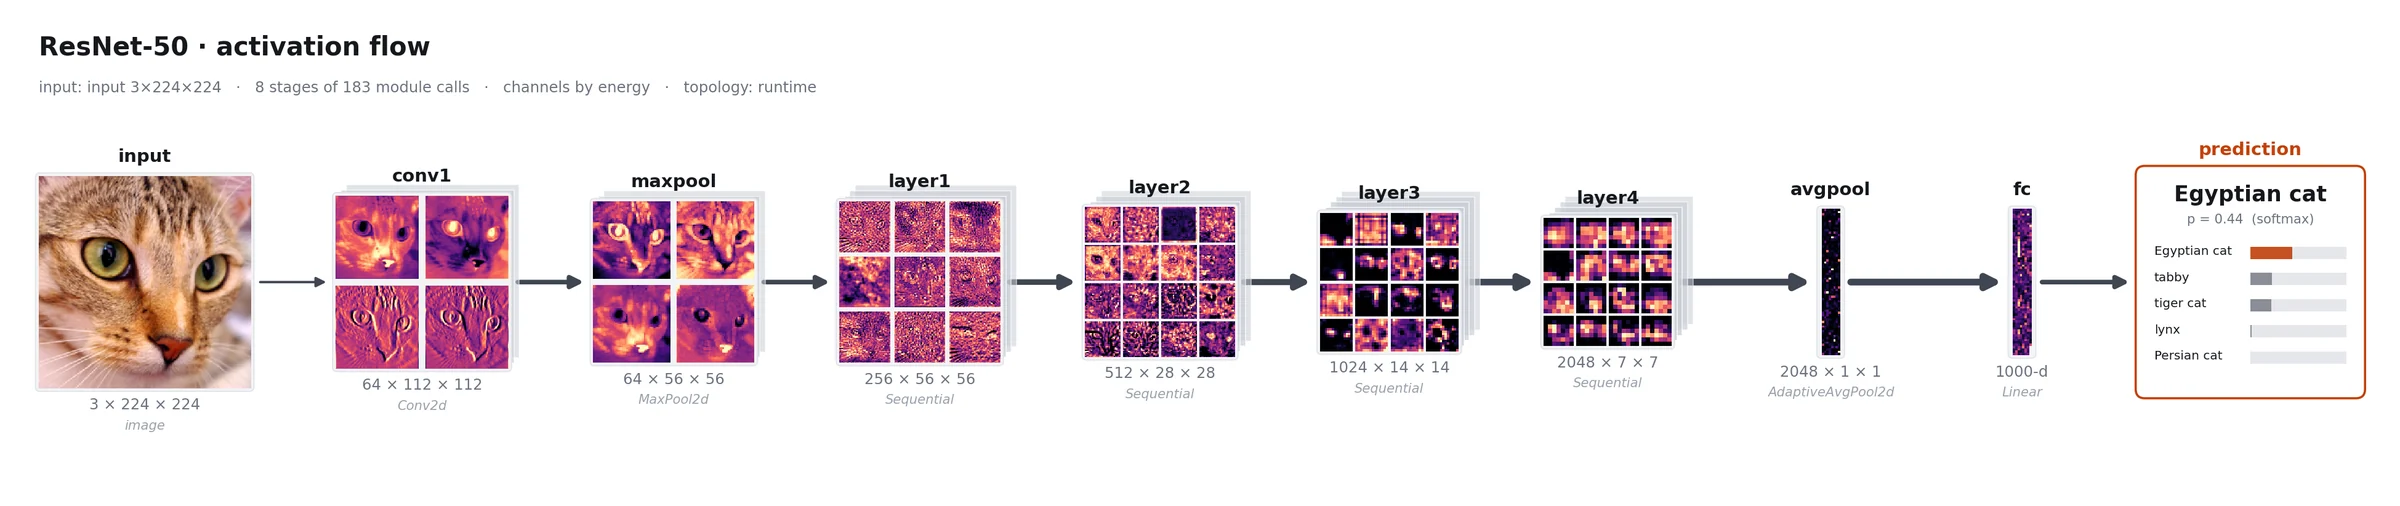
style="technical" — exact shapes and module names for papers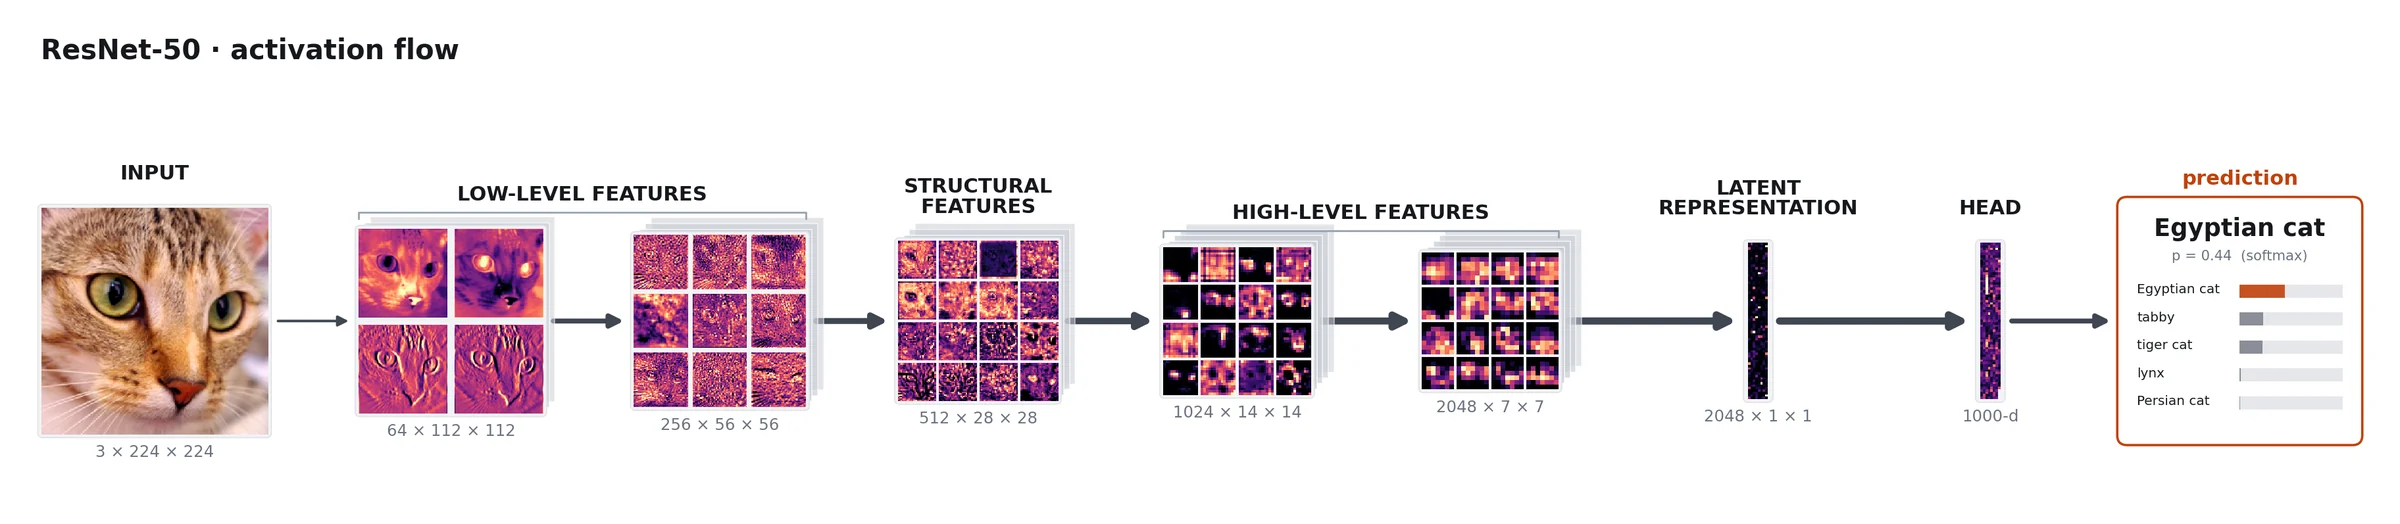
style="story" — plain-language stage names for teaching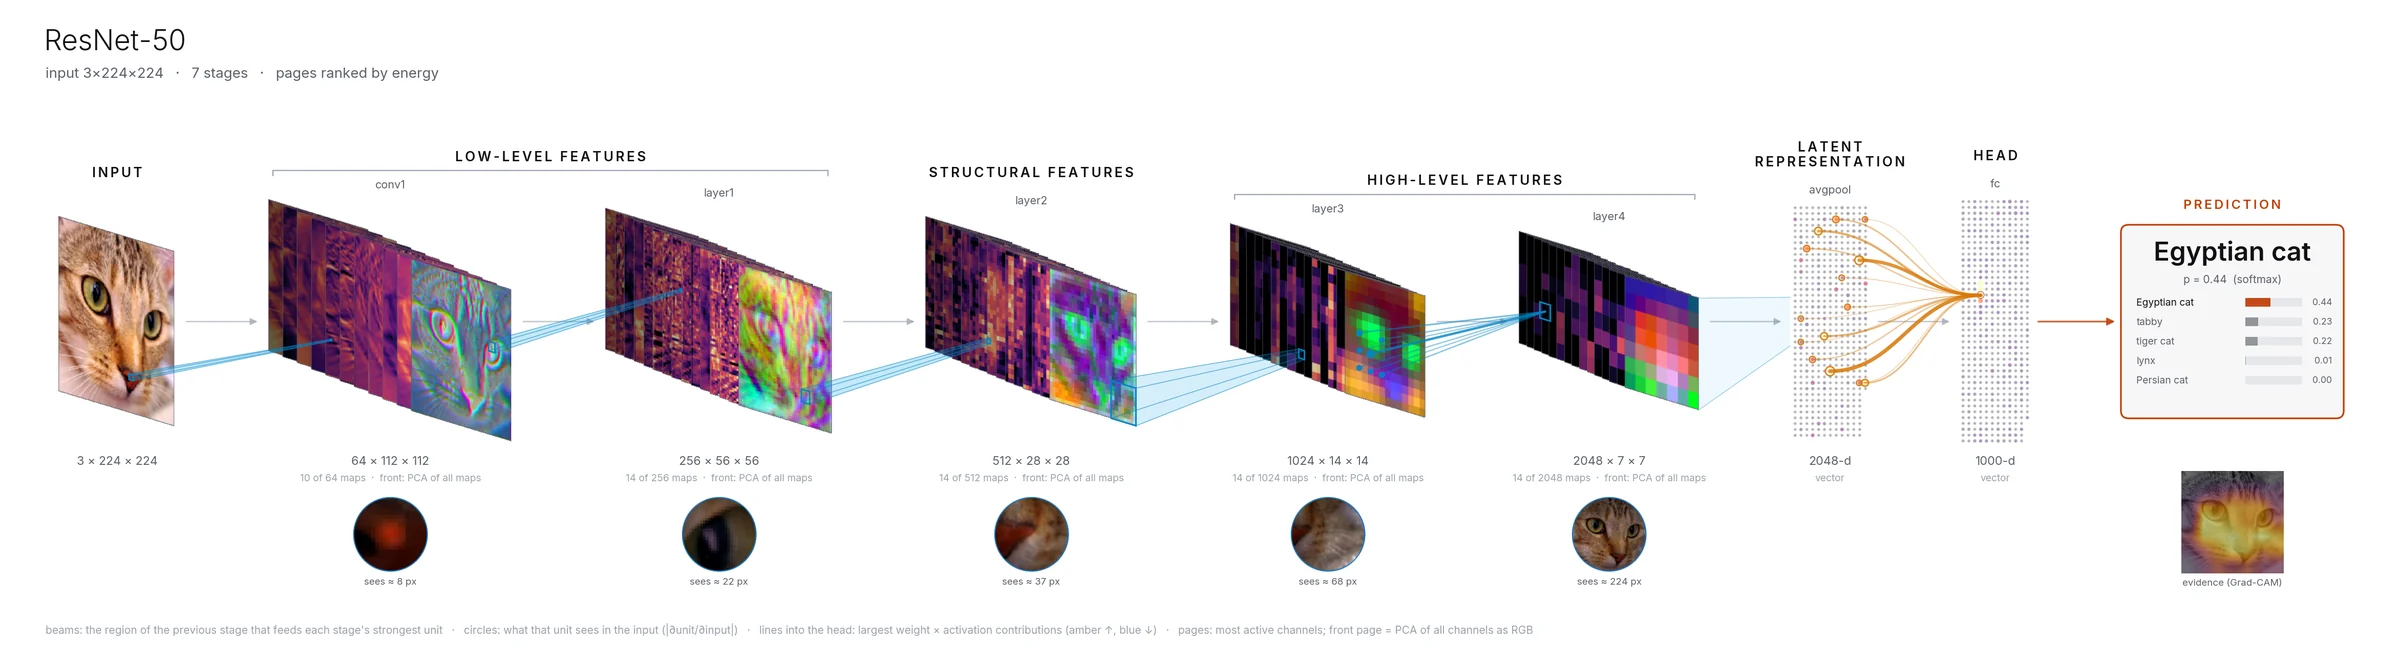
style="cinematic", theme="light" — for posters and white slidesForward hooks and a runtime dataflow tracer record every module call, its shape, and the real wiring: skips, merges and branches.
A module-tree cut picks 5–12 stages that change the representation, grouped into concepts such as “low-level features” or “decoder”.
Gradients give each stage's receptive field, its dependency on the previous stage, head contributions and Grad-CAM.
2-D maps, 3-D volumes, tokens, vectors and attention become pictures: figures, the HTML explorer, or movies.
 interactive
One self-contained HTML file: click a stage to see its module, shape and value statistics, switch the channel ranking, expand individual channels and browse attention heads. No server needed.
 .pptx
.pptx
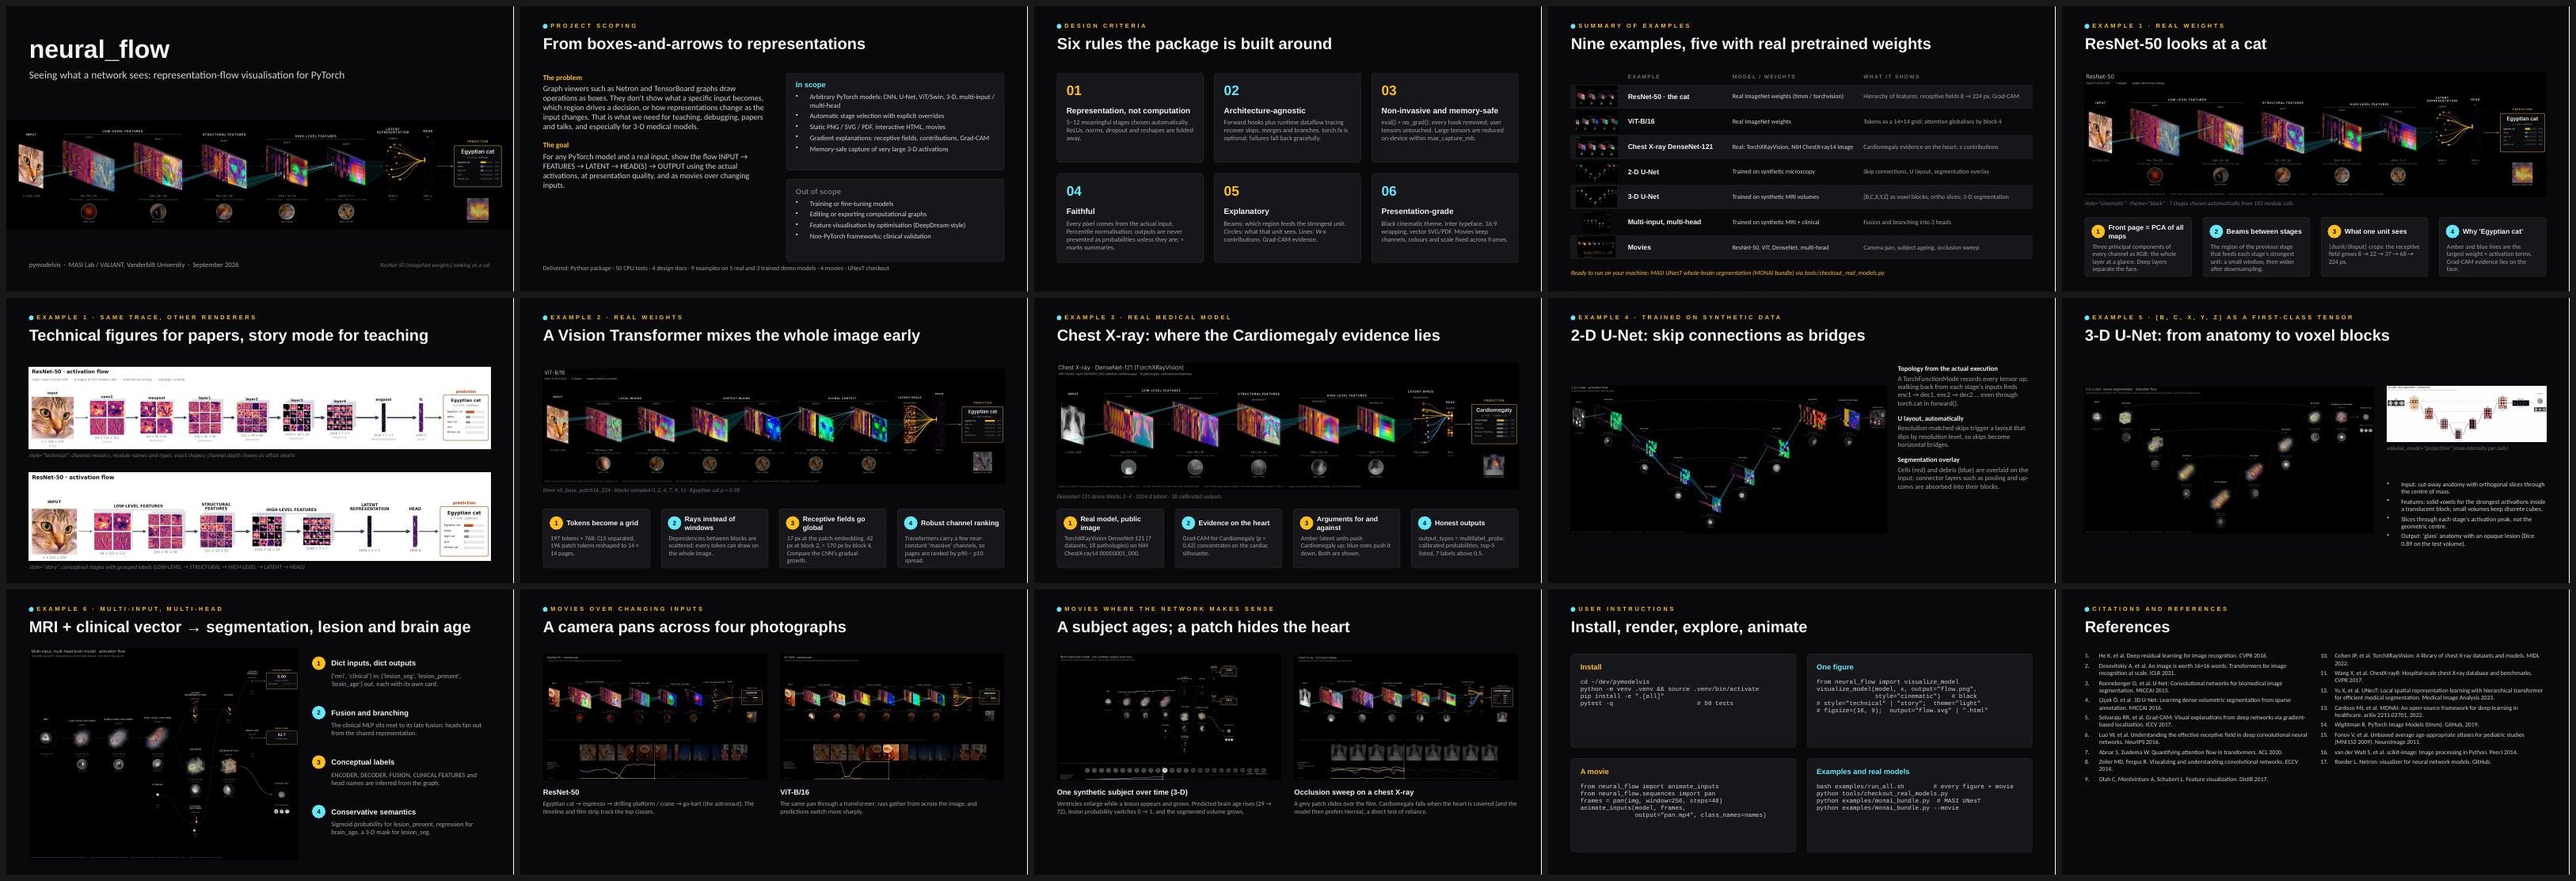
A 15-slide PowerPoint with the figures, four embedded movies and speaker notes — an example of what the tool produces for a talk, and a template for your own.
Developed at the Medical-image Analysis and Statistical Interpretation (MASI) Lab and VALIANT, Vanderbilt University. Released under the BSD-3-Clause license. Issues and pull requests are welcome.
@software{landman_pymodelvis_2026,
  author  = {Landman, Bennett},
  title   = {pymodelvis / neural_flow:
             representation-flow visualization
             for PyTorch models},
  year    = {2026},
  version = {0.1.0},
  url     = {https://github.com/MASILab/pymodelvis},
  license = {BSD-3-Clause}
}